Marketing Dashboards
Focus on Innovation, Not Data Collection
Marketing Dashboards that Save Time and Spark Innovation
Marketing is more data-rich than ever, but visibility into that data isn’t always easy.
If your team is stuck in reporting that requires endless cycles of data collection from multiple sources, you’re sacrificing time and accuracy and meanwhile never even getting to the stage where you can actually analyze the data and innovate based on what you discover.
When marketing leaders want to increase visibility into marketing data and leverage it for decision making, dashboards are a great place to start. Two Octobers’ team of marketers and technologists has built hundreds of dashboards integrating data from a dozen different platforms. We understand the needs of marketing teams and the data that underlies KPIs.
We Build Dashboards that Fuel Data Driven Marketing Teams
- Build reporting dashboards incorporating marketing data from a variety of sources
- Build user-friendly dashboards for data segmentation and analysis
- Audit and QA existing dashboards
- Learn to build dashboards with customized training
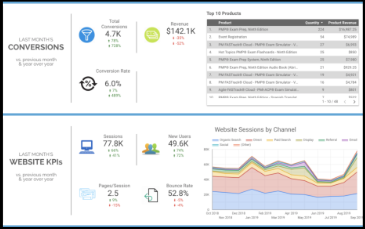
We're-All-on-the-Same-Page Reporting Dashboards


Thoughtful Analysis Dashboards
We Specialize in Dashboards that Get Used
Starting with understanding who will use the dashboards and why, we design metrics visualizations for KPIs that matter. Our process ensures on-target execution and ongoing impact.
We’ve built dashboards from scores of data sources, including: Google Analytics, Google Search Console, Google Ads, Meta, TikTok, Pinterest, LinkedIn, StackAdapt, CallRail, Classy, Calendly, PatientFirst, Salesforce, Hubspot, Marketo, Shopify, Blackbaud/Convio, Magento, Woocommerce, and YouTube. We build dashboards in Google Looker Studio, Tableau, and Salesforce.
How It Works
- Strategy
- Understand team goals and stakeholder needs
- Define visualization and data integration requirements
- Evaluate and select dashboard platform
- Implementation
- Connect data sources
- Build visualizations
- Test data and usability
- Training
- Train team to leverage dashboards and analyze data for insights.
- Maintain & Optimize
- Maintain data connections
- Evolve dashboards for team needs and new opportunities
We’ve Helped Clients Like You
A leading bike shop needed a better way of understanding ecommerce sales data. Two Octobers designed a dashboard that displayed both summary and drill-down data for review & investigation.
"Two Octobers put together reports for us so we can better forecast, evaluate, target, and triage areas that need attention. Without the report that was built for us we'd continue to operate with unnecessary blind spots." - Greg McDonald, Ridley's Cycle
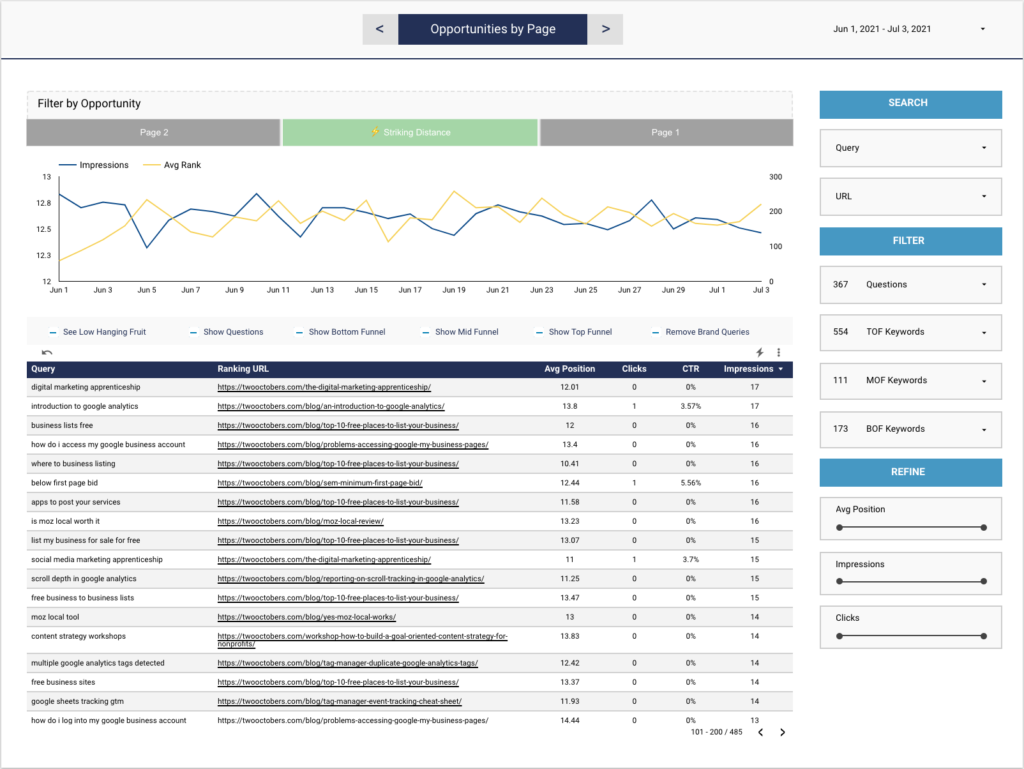
Two Octobers built Branch Explorer as a better analysis tool for Google Search Console data. Built as a Looker Studio dashboard and used by dozens of companies across hundreds of domains, it helps uncover opportunities for SEO improvements.
"Explorer is a very handy tool, the fact that I can blend data on the front end and combine it with different data sources...basically you can start developing small workflows where you can help internal teams make the right decisions." - Arnout Hellemans, OnlineMarkethink


