Looker Studio recently added a funnel chart visualization, which is a very welcome addition. In this post, we share a couple of tricks for reporting on sequences of GA4 events using a funnel.
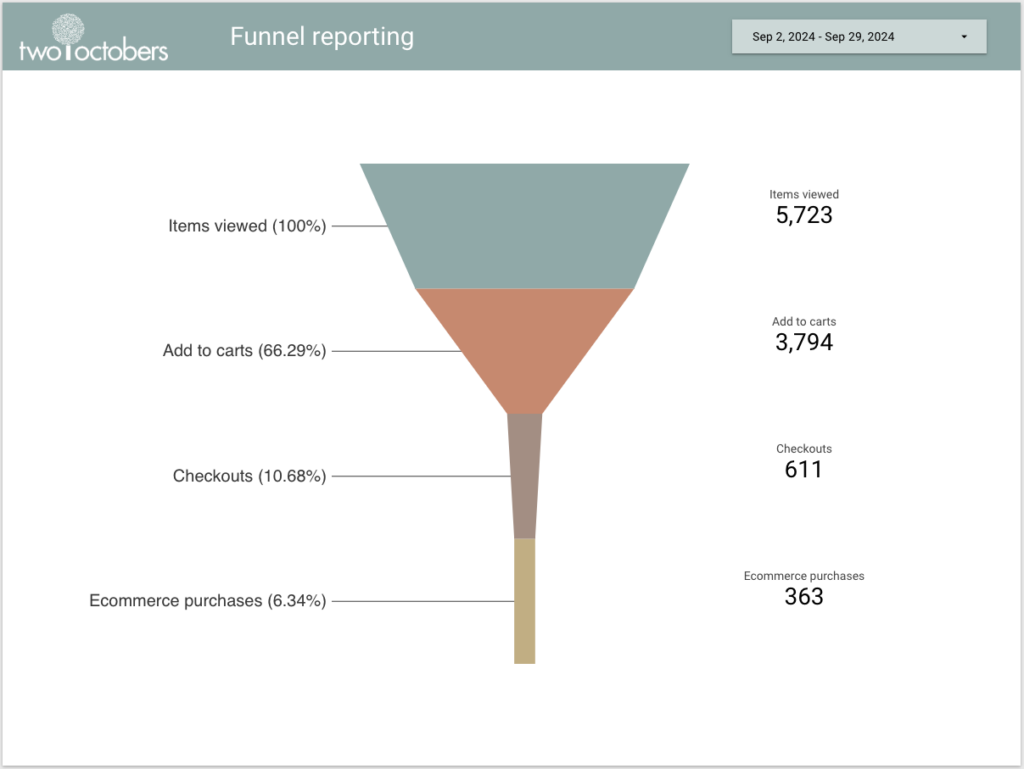
Below is the chart we are going to build – it reports on a common sequence of ecommerce events, but you can use the same techniques to report on any standard or custom events.
Step 1 – Add the funnel chart
- Click ‘Add a chart’ on the top bar. Down at the bottom, you’ll see three options for funnel charts. Pick any one of them to start, you can change between the different types later to see which you like most.
- Make sure the chart is connected to your GA4 data source.
- Pick ‘Event name’ as your dimension
- Pick ‘Event count’ as your metric
You will now have a not-very-useful chart showing all of your GA4 events. Let’s make it useful!
Step 2 – Filter for the events you want
Select ‘ADD A FILTER’ at the bottom of the setup pane, then select ‘CREATE A FILTER’ at the bottom of the next pane. The trick here is that you want to filter for a list of events. You can do that with an AND condition in your filter, but I find regular expression matching faster and easier. The pipe symbol is an OR condition in a regular expression, so we will just list the events we want, separated by pipes.
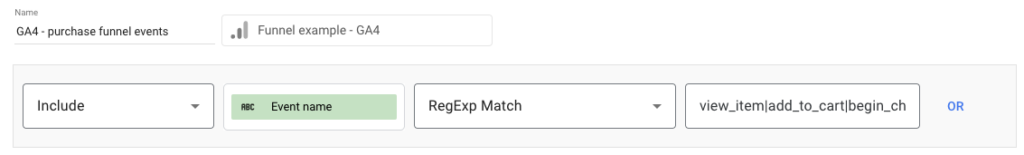
Here is the complete value of the RegExp Match condition:
view_item|add_to_cart|begin_checkout|purchaseNow you should only see your events of interest.
One thing to note is that the funnel will default to sorting by the metric you selected in descending order. You can change it to ascending, or sort by another metric, but you can’t specify an order that is not descending or ascending. This can matter in cases where you have a step in a funnel that not all users take. For example, on an ecommerce site, purchasers without an account might complete a ‘create_account’ event, but purchasers who already have an account do not. It doesn’t necessarily make sense to include this event as a funnel step, but if you want to, I’ll describe a way to have it sort correctly with my next trick.
Step 3 – Make the event names prettier
Next we are going to add a calculated field that translates your event names into more human-readable versions. To do this, you’ll start by editing your data source (Resource > Manage added data sources > EDIT, then click ‘ADD A FIELD > Add calculated field’ in the upper-right.
I named mine ‘Pretty event name’, but call it whatever you like.
CASE
WHEN Event name = 'view_item' THEN "Items viewed"
WHEN Event name = 'add_to_cart' THEN "Add to carts"
WHEN Event name = 'begin_checkout' THEN "Checkouts"
WHEN Event name = 'purchase' THEN "Ecommerce purchases"
END
You might notice that I used the names of the standard GA4 metrics that correspond to these events. If you are including events with standard metric names, I recommend doing this.
Save the calculated field, then change the dimension in your chart to use the field you created.
Note that if you want to control the order in which your events appear, you can add numbers before each pretty event name, then sort by ‘Pretty event name’ ascending. For example, if for some reason I have more Checkouts than Add to carts, I could change the names to:
“1. Items viewed”, “2. Add to carts”, “3. Checkouts”, “4. Ecommerce purchases”
If you’ve never added a calculated field before, they are crazy-powerful! We use them in our guide to scroll tracking reporting and our tutorial on reporting on individual GA4 conversions. Here is Google’s documentation on how they work.
Step 4 – Add scorecards with event counts
You’ll notice that you can see event counts when you mouse over each stage in the funnel, but in my experience a lot of users don’t find interactive features like that, so let’s finish by adding scorecards showing totals counts for each event.
Click ‘Add a chart’ on the top bar. Select one of the Scorecard chart types.
Pick the Metric that matches the stage of the funnel, for example ‘Items viewed’ or ‘Add to carts’.
Repeat for each stage of the funnel.
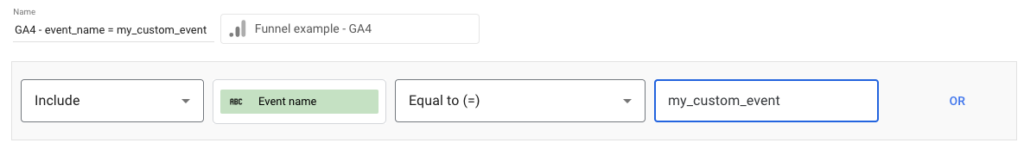
The events I chose all have built-in metrics, but if you include custom events for which you have not created custom metrics, you can set the scorecard to use ‘Event count’ as the metric, then add a filter for your event name. The filter will look something like this:
Funnel visualization options
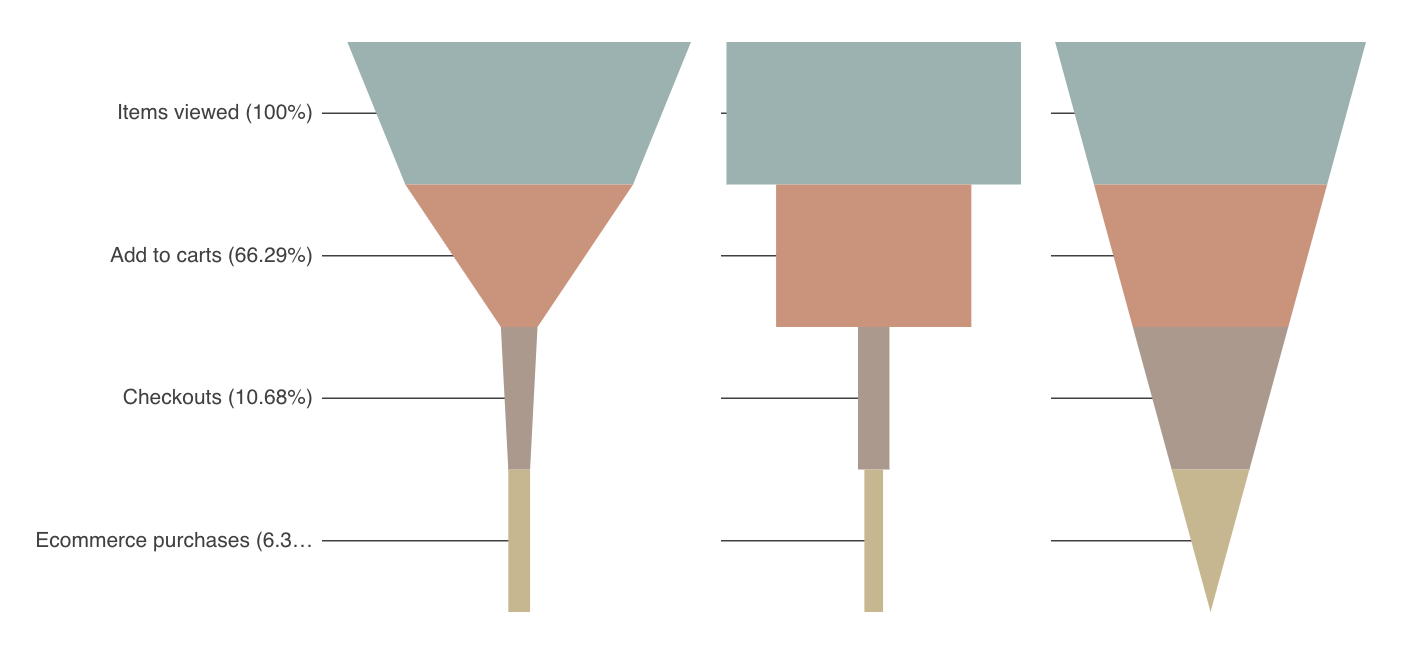
There are lots of formatting options with funnel charts, and you’ll definitely want to play with those. Also, you can select ‘Chart’ at the top of the setup pane to switch between chart types. I personally like the smoothed bar version the most, but the inverted triangle is better if your funnel starts with a large number and goes down to a much smaller number.